Everyone has a different level of ability. Some levels of ability require more support so they’re called dis-abilities. Regardless, we all deserve proper access to education, employment, health care and housing. That’s why the Australian Institute of Health and Welfare launched Australia’s Disability Strategy in 2021 to measure how disability inclusive Australia is for people with disabilities.
While Australia has some great support schemes, from the NDIS to My Aged Care, there’s plenty of room for improvement. The new Australian Disability Strategy is measuring key areas of life to see where that improvement needs to be made.
The strategy has been in place for over a year now and the first set of data is already available. In this article, Blue Badge shares some of the outcomes of this report. Let’s see how inclusive we are as a nation.
In this article
What is the new Australian Disability Strategy?
Before the Australian Disability Strategy, we had the National Disability Strategy. They’re essentially the same but one is the new version that will run until 2031.
They’re both 10-year strategies. The Australian Disability Strategy runs from 2021 to 2031 and the earlier National Disability Strategy ran from 2010 to 2020. Even though a lot was achieved for disability inclusivity during this time, there’s still much to be done before Australia is as inclusive as it can be.
It’s an ongoing process where we can continually improve. The NDIS overhaul is an example of such development.
How did it come about?
To assess what major lifestyle gaps exist in disability inclusivity, the Australian Institute of Health and Welfare sought input from people with disabilities. In other words, people with firsthand experience of what needs improvement.
Seven main focus areas were identified and these are known as Australia’s Disability Strategy Outcomes Framework. Here’s what they cover, broadly speaking:
| 1 | Employment and financial security |
| 2 | Inclusive homes and communities |
| 3 | Safety, rights and justice |
| 4 | Personal and community support |
| 5 | Health and wellbeing |
| 6 | Education and learning |
| 7 | Community attitudes |
Australia’s Disability Strategy Outcomes Framework
Together, these seven key focus areas make up Australia’s Disability Strategy Outcomes Framework. Information is being gathered across each of these seven aspects of life in terms of inclusivity. These measures are used to gauge where improvement needs to happen on the ground.
Data sources
The data that is being used to find out whether Australia is disability inclusive enough – and help it become so – comes from a range of sources. These include the NDIS Quality and Safeguards Commission and the Department of Social Services – Disability Employment Services, to name a few.
Data capture
The data is being captured so the government can improve the lived reality for people with disabilities. The information is available online for everyone to see here. For example, the number of NDIS participants in employment improved from 20% to 21% between 2021 and 2022, and the number of vocational (VET) graduates with disability who got a job after training jumped from 52% to 59% in that same time.
However, the amount of time people with disabilities had to wait for social housing has become worse. It went from 413 days to 557 days for public housing and 389 days to 416 days for state owned and managed Indigenous housing.
Improving disability inclusive outcomes
The above are just a few examples. The data clearly shows where improvement is needed. People with disabilities will work with government, business and community to help these changes happen. Let’s take a look at the best and worst measures for each of these seven key areas.
Best and worst outcomes for 2021-22
We already know about the seven main focus areas being looked at in the Australian Disability Strategy. In addition, each of these focus areas is looked at across roughly 10 sub-categories.
For instance, the first point on Australia’s Disability Strategy Outcomes Framework is employment and financial security. This is then broken down into different important aspects that all need to be measured and improved on. Like employment by age or how many people with disabilities have permanent employment. Another way to slice and dice the results is by seeing whether there are wage discrepancies between people with and without disabilities.
To get a good idea of how well Australia is doing in terms of disability inclusivity, here’s an overview of each of the seven categories. We also note if these are improving, getting worse or didn’t really change between quarter two of 2021 to 2022.
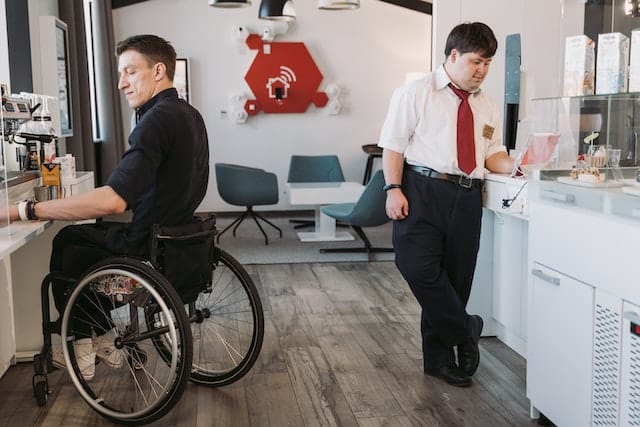
1. Employment and financial security
Is employment security, and the financial security that comes with that, disability inclusive enough in Australia? Here’s what the Australian Institute of Health and Welfare shows so far for the Australian Disability Strategy:
✅ Improving
- Age appropriate NDIS participants who are earning full salaries, 20% –> 21%
- Graduates who got a job after vocational training, 52% –>59%
- Young NDIS participants between 15 and 24 years who have a job, 18% –>19%
- Australian Public Service employees who have a disability, 4.5% –> 4.7%
- Full time employment for people with disabilities, 16,041 –> 26,242 (number of claims to the Disability Employment Services)
🚨 Worse
- Number of NDIS participants getting adequate support to be able to work, 66% – 64%
🔀 No change or not yet unknown
Some Australian Disability Strategy data hasn’t changed between 2021 and 2022, hence shows no progress, or the latest data isn’t available yet. For example the latest data on people with disabilities who had at least one job over 12 months that gained them 26 weeks of work was measured at 7.5% and the latest data isn’t yet available.
Further, some data is outdated. For example, the gap between the number of unemployed people with and without disability was last measured in 2018 at 4.7%. The same goes for young people aged 15-24 with disabilities who have a job, which in 2018 was 76%. In 2018 people with disabilities earned $511 less per week than those considered ‘able’ bodied.
These figures still need to be updated before we know whether we’re backsliding or making progress.
Read our article on disability employment and our guide to disability in the workplace for more on this topic. Also hear what Dylan Alcott has to say on the matter in our article on Able Foods.
2. Inclusive homes and communities
Sadly, there’s currently no measure that gets the green light under inclusive homes and communities (while lamenting that, read our articles on disability housing and how to create an accessible home).
🚨 Worse
- NDIS participants doing activities they enjoy in their spare time, 66% –> 65%
- Number of NDIS participants who are happy with their housing, 73.4% –> 73%
- The amount of time people with disabilities wait for social housing, 413 days –> 557 days (public housing) and 389 days –> 416 days (state owned and managed Indigenous housing)
🔀 No change or not yet unknown
There’s still a lot of outdated Australian Disability Strategy data under this category. The latest figures for several key measures are from 2018.
For example, how many people with disabilities are engaging in community and social activities (95%). Percent of people who find it difficult accessing government buildings (8.1%). Who find no problems accessing buildings and other facilities (69%). Who have adequate access to public transport (66%).
Some data is newer but still needs to be measured against the latest year. For example, the proportion of low income households (lowest 40%) with at least one household member who has a disability where their housing costs are greater than 30% of the household income was 18% in 2019-2021.
In 2021 digital inclusivity for those with disability compared to those without measured 9.1 out of a score of 100 points. (Read about smartphone accessibility features and useful gadgets for living with disability.)
Lastly, some data sets on the Australian Institute of Health and Welfare are still empty. There’s likely a lot going on behind the scenes, but for now we’ll have to wait to find out what progress has been made across several areas.
These include social housing that meets Livable Housing Design silver accessibility standards, Disability Standards for Accessible Public Transport being met and Government websites that meet Web Content Accessibility Guidelines.
3. Safety, rights and justice
Safety, rights and justice for people with disabilities still has a way to go with gathering data to see what’s really happening. Many of the areas of focus in this category don’t have any data yet. These include:
🚨 Worse
- Complaints to Australian Human Rights Commission for disability discrimination that were resolved through conciliation, 72% –> 62%
- NDIS participants who feel empowered to self-advocate, 37.3% –> 37.1%
- Proportion of people with disability who are provided accommodation when experiencing family or domestic violence, 82% –> 79%
- Better options and improved control over own decision making for National Disability Advocacy Program (NDAP) clients, 62% –> 59%
🔀 No change or not yet unknown
The unknown Australian Disability Strategy figures here are still many. There are currently no datasets for services that take a trauma-informed approach or the amount of time kids with vs without disability spend in child protection, to name a few.
Old figures show that adults who experienced violence after the age of 15 was measured in 2016 at 47% for people with disabilities vs 36% for those without. In 2016 women who’ve experienced domestic violence was 44% vs 30% for women who don’t live with disability. Also in 2016, 52% of adults with disability actively sought support after an assault.
In 2019, the last measure of people with disabilities experiencing NO discrimination over a year long period was 90%. 2021 figures on NDIS abuse and neglect complaints were 1.5 complaints per 1,000 participants.
4. Personal and community support
The majority of data for personal and community support is yet to be tracked or updated. One improvement and one regression can be noted:
✅ Improving
- NDIS participants who feel the scheme helped them have control and choice in life (after two years as a participant), 75% –> 76%
🚨 Worse
- NDIS participants who received more than $1,500 for assistive technology supports, 18% –> 16%
🔀 No change or not yet unknown
Most of the Australian Disability Strategy data sets here aren’t known yet or they’re old. These include 2018 figures for people with disabilities who are happy with the quality of formal and informal assistance: 79% (15–64 years) and 84% (over 65).
The proportion of people with disabilities whose needs were comprehensively met was also last measured in 2018, at 72%. In the same year carers satisfaction with available services to assist measured 50%.
Informal carers who received adequate respite care measured 86% in 2018. In the same year the proportion of people with disabilities who don’t need additional aids was 94%. NDIS participants who could access effective systems via their support package still needs to be measured.
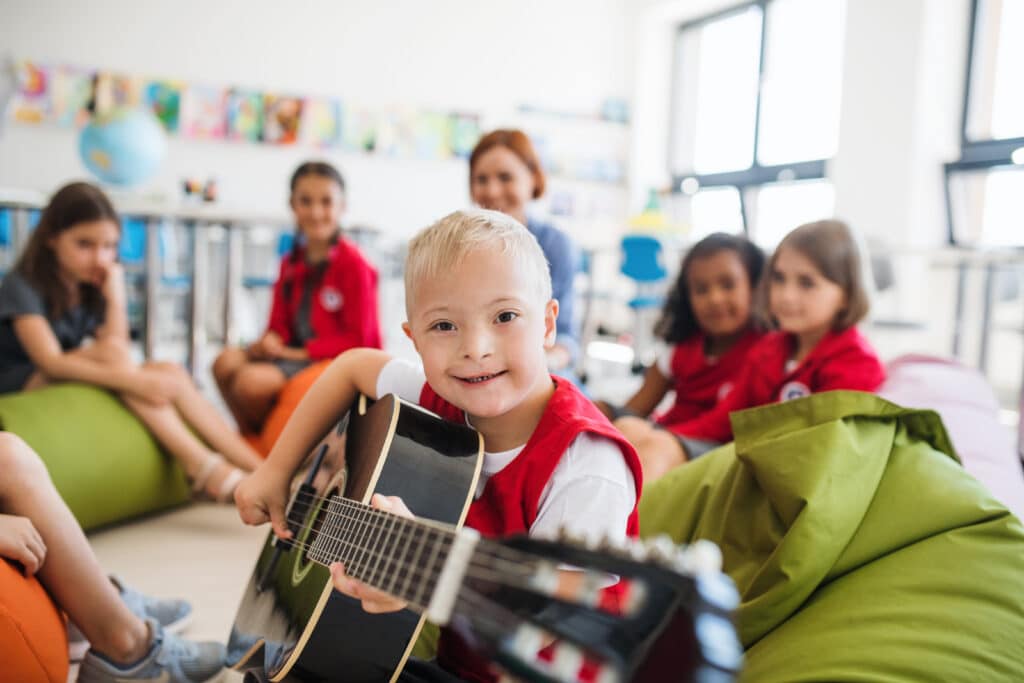
5. Education and learning
Education and learning are essential to a sense of fulfilment, participation and access to inclusive disability work opportunities. This applies whether we’re talking about formal or informal learning across age groups. In this focus area, the pieces of the puzzle are still missing or outdated.
🔀 No change or not yet unknown
The Australian Disability Strategy measures for preschool enrolment for people with disability can’t be directly compared because the ‘definition of disability varies across jurisdictions.’
The number of people with disabilities who completed year 10 (45%) and year 12 (45%) is also from 2018. The proportion of students with disabilities in vocational education and training measured at 4.4% in 2021, while in 2017 the graduate rate here was 40% (with disability) vs 46% (without disability). In 2020 undergraduate students with disabilities measured 8.1%.
Between 2015 and 2020, 51% of people with disabilities completed a higher education qualification. No data is ready for school preparedness, attendance and reaching the ability to read by year 9. There’s also no data for adult and community education access and participation in informal learning activities.

6. Health and wellbeing
Health and wellbeing is a topic that shouldn’t be disputed – it’s a basic essential. In this outcome, there’s one green light for progress and many unknowns. Let’s take a look:
✅ Improving
- NDIS participants who are happy with life, 46% –> 47%
🔀 No change or not yet unknown
Australian Disability Strategy data for unmet hospitalisation needs was last updated in 2018, at 10% of people with disabilities with such needs. Before that, from 2017 to 2018, the proportion of people who reported being healthy with disability came to 69%, vs 94% without disability.
2018 is the last available measure for the number of people with disability who had avoidable health emergencies (119,500 people). This year is also the last measure for medical facility accessibility, at 14%, and adults with (high or very high levels of) psychological distress at 31%.
Future data development is needed in areas of community health care satisfaction, how often people with disabilities are restrained in acute mental health hospital services and involuntary hospital admissions. This is also the case for disability inclusive disaster management plans and services and the lived experience of accessibility to these supports.
7. Community attitudes
Although community attitudes is the last Australian Disability Strategy outcome, this is super important to all the others. If every Australian – with or without disability – had an inclusive attitude this could mean the world of difference. If you consider all people to have varying levels of cognitive and physical abilities, then being inclusive is simply a natural way of life.
It shouldn’t be that you have to ‘see’ someone has a wheelchair, walking stick or other mobility equipment before you leave the accessible parking bay available for them. It’s just common courtesy to understand the various supports available to make life smoother when living with disability need to be accessible and protected for those who need them.
In this category, all the data still needs to be developed. When it is, the focus areas will include employer attitudes, key sector attitudes, representation in leadership and a sense of feeling valued and respected.
To wrap up this section, read our Invisible Disabilities Survey and find out about attitudes that need to change. If you find your own attitude changing when reading other people’s experience of harassment, share the article to raise awareness.
The Australian Disability Strategy includes you
While the Australian Institute of Health and Welfare has launched the Australian Disability Strategy, much remains to be seen. In the meantime, each of us has our own part to play in making Australia more inclusive by raising understanding and living our best lives.
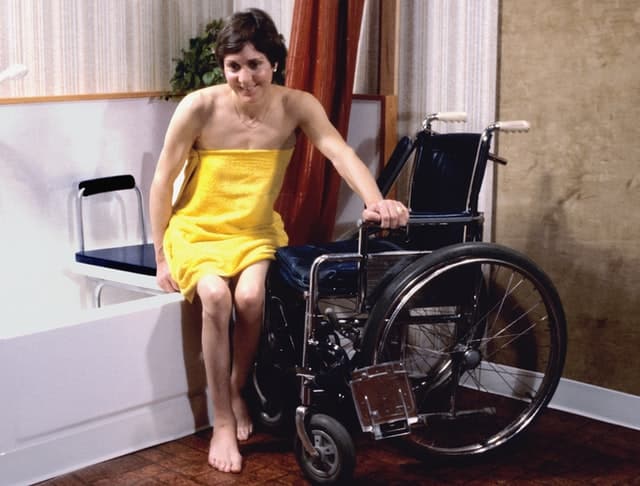
While we’re talking about living your best life, be sure to protect the mobility equipment that’s essential to your mobility. It’s a freedom everyone deserves, but if your converted car, wheelchair, or scooter gets stolen or broken it can be costly to fix or replace.
Blue Badge Insurance can help you pay for the repairs you need or the cost of replacing your scooter, wheelchair or car. Learn about getting affordable, high quality wheelchair insurance and mobility scooter insurance.
Click below to get a quote.